Wuhan University
Hubei University
Jul 2023 - Present
Many arthropods employ Batesian mimicry, yet empirical evidence for transformational mimicry and locomotor mimicry remains limited. We investigated the wolf spider Arctosa kiangsiensis, which exhibits an ontogenetic shift in locomotor ant mimicry: juveniles resemble the smaller ant Pristomyrmex punctatus, while adults mimic the larger Formica cunicularia. Locomotion analyses showed stage-specific resemblance to co-occurring ants, while spectrophotometry and avian vision modeling confirmed visual similarity to both ants and background. Predation assays with chicks further demonstrated reduced attack rates on A. kiangsiensis compared to non-mimetic controls. Our results reveal that A. kiangsiensis integrates locomotor mimicry, transformational mimicry, and background camouflage, providing stage-matched protection and enhancing survival under avian predation.
Arthropods adopt diverse protective strategies such as crypsis, camouflage, and Batesian mimicry, where edible species resemble unpalatable models to deter predators. Ants serve as effective models due to their defenses and unpalatability, and many spiders mimic ants to reduce predation. While morphological mimicry in spiders has been widely studied, locomotor mimicry remains less explored.
Moreover, although some species exhibit transformational mimicry by shifting models during development, this phenomenon has been little studied, particularly in spiders. We hypothesize that such shifts may help maintain size-matched resemblance to worker ants, thereby optimizing survival across ontogeny.
Here, we examine the wolf spider A. kiangsiensis, which displays stage-specific locomotor resemblance to two co-occurring ant species, and test its visual similarity and protective value against avian predators.
We collected mimetic spiders (A. kiangsiensis), non-mimetic spiders (P. laura), and two ant species (F. cunicularia and P. punctatus) from Shizishan, Wuhan (2022–2024). Spiders were kept individually and fed flies or crickets, while ants were group-housed and fed sugar water.
Locomotion was recorded in a controlled arena under LED light, with trajectories tracked frame by frame from video recordings. Movement parameters (velocity, acceleration, sinuosity, directional change, and auto-correlation) were extracted, smoothed, and compared across species and size groups using PCA and multiple group comparisons with post hoc tests.
Color resemblance was assessed via spectrophotometry (300–700 nm) of spiders, ants, and environmental elements. Spectral data were analyzed with avian visual models (VS and UVS systems) to estimate chromatic and achromatic contrasts.
Chick predation experiments were conducted under daylight illumination in controlled arenas. Naive domestic chicks were exposed first to ants and then to paired mimetic and non-mimetic spiders. Predator responses (detection, attack, hesitation time) were video-recorded and analyzed across 96 trials.
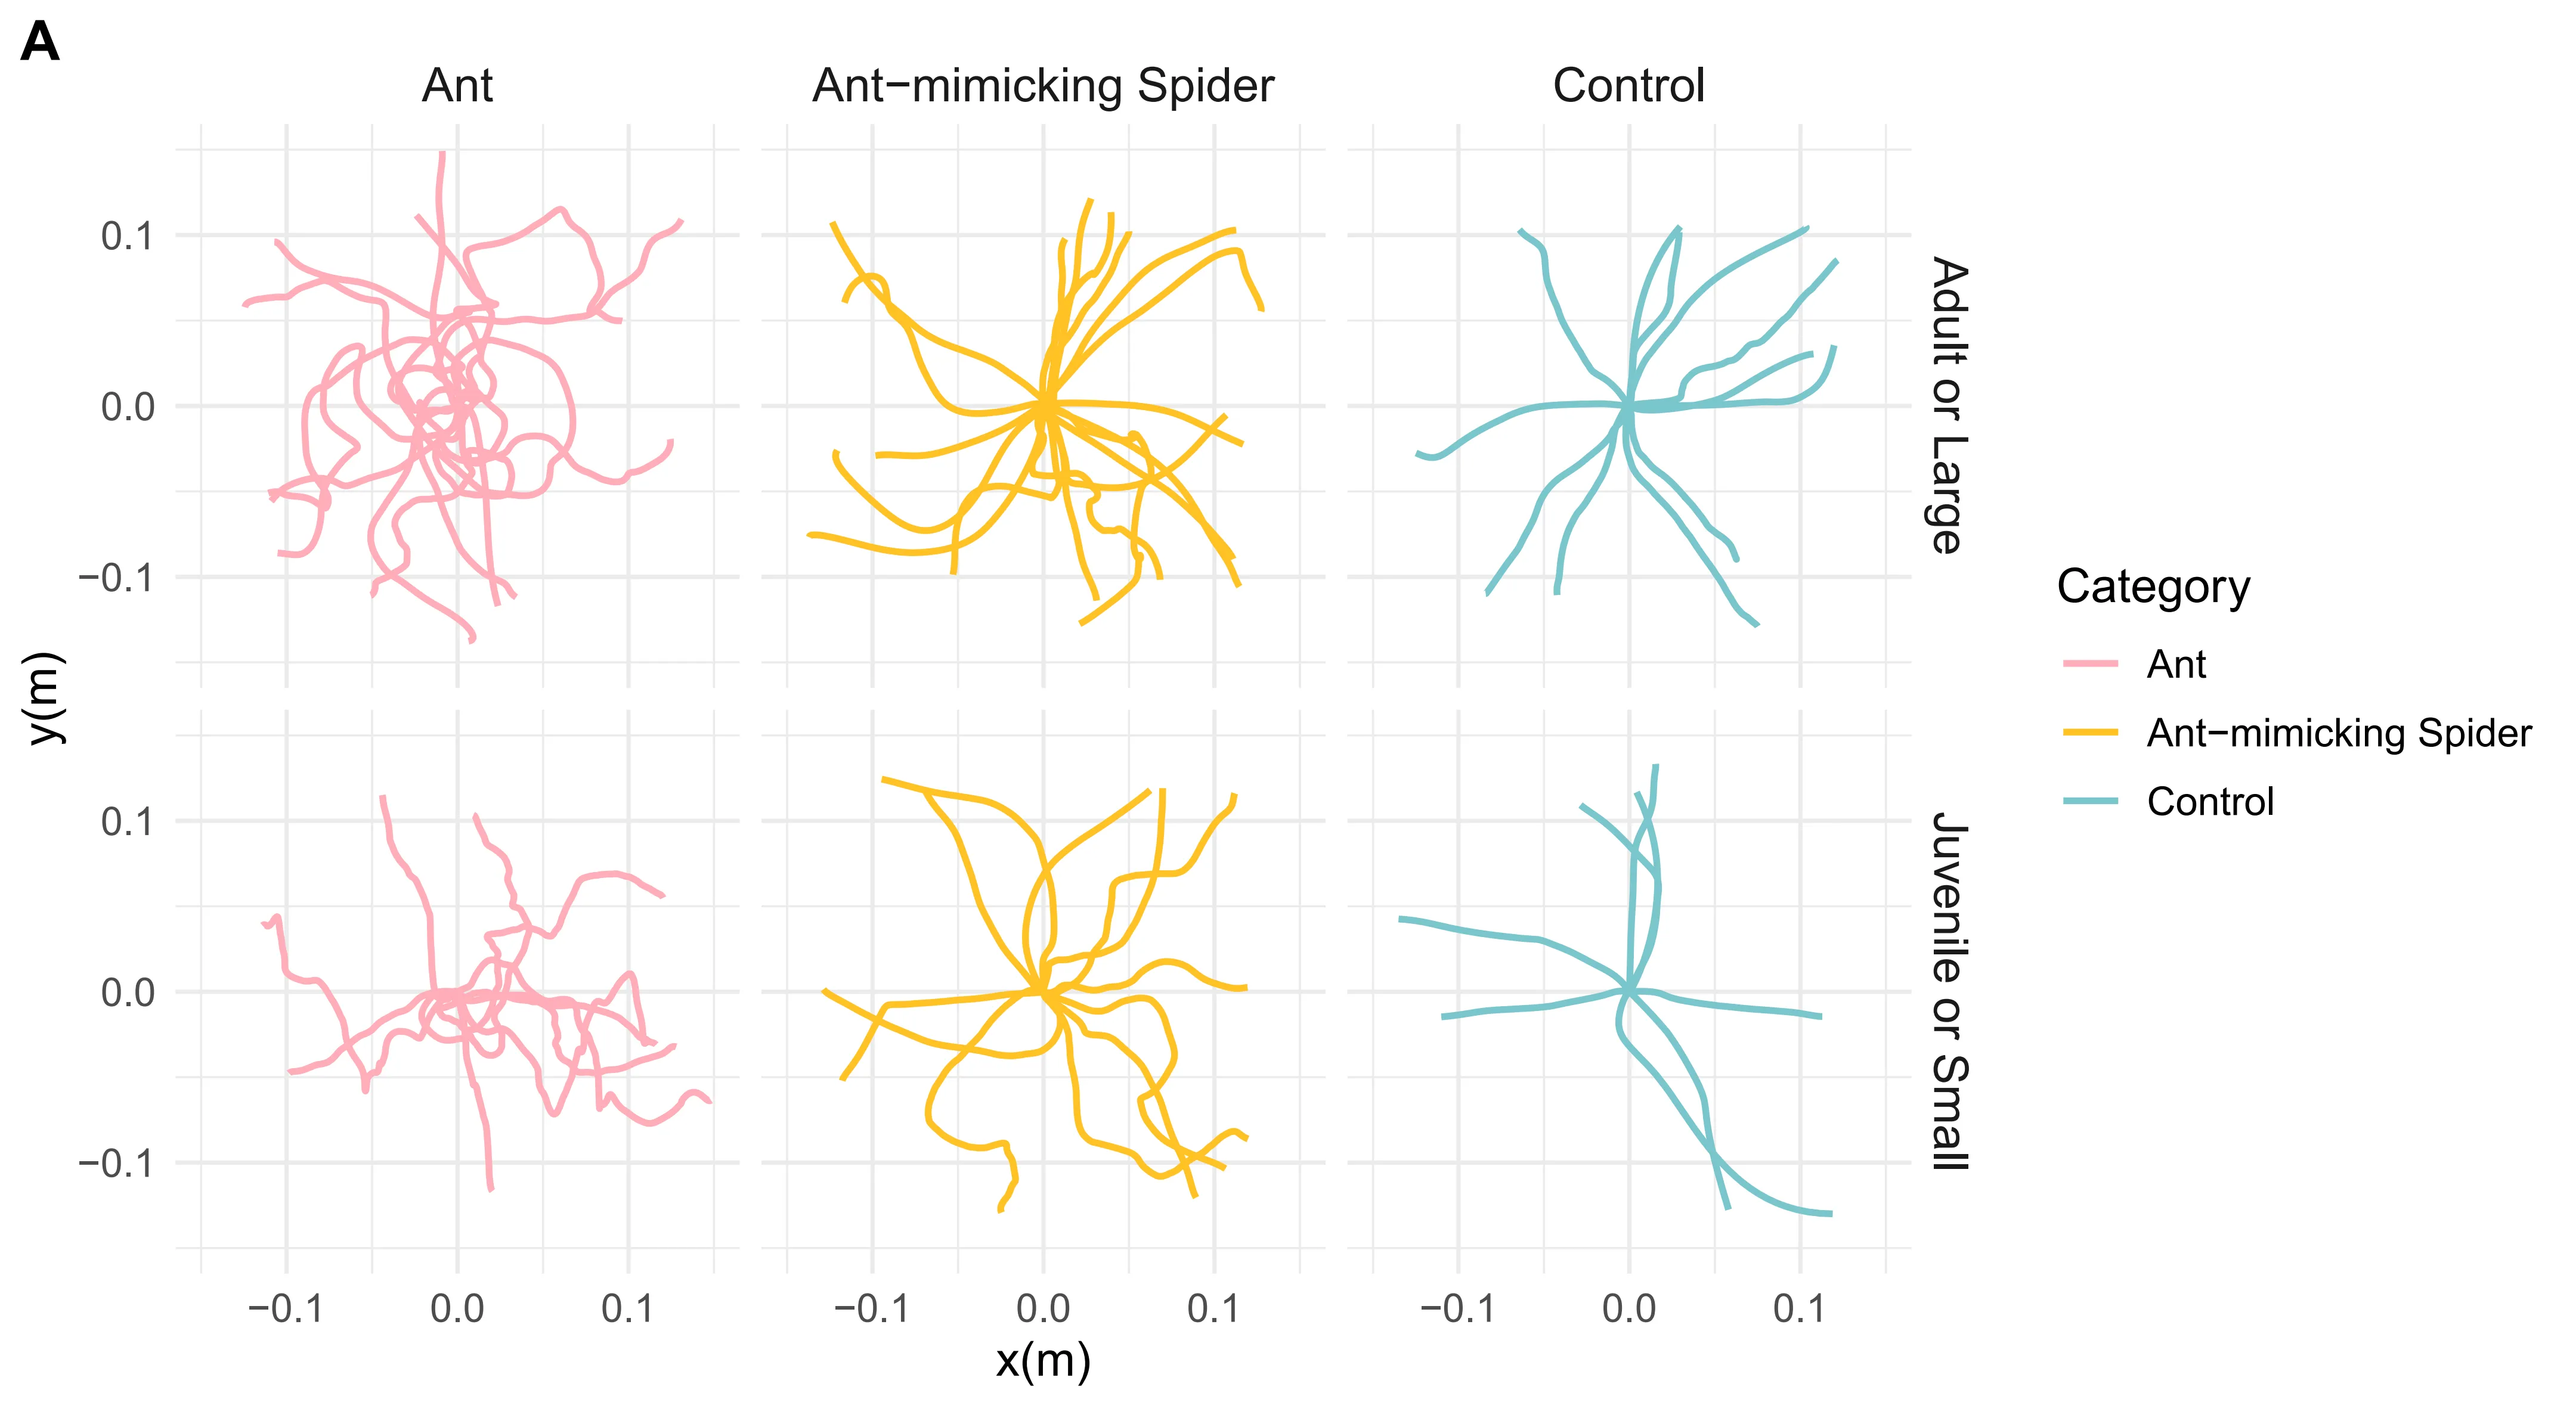
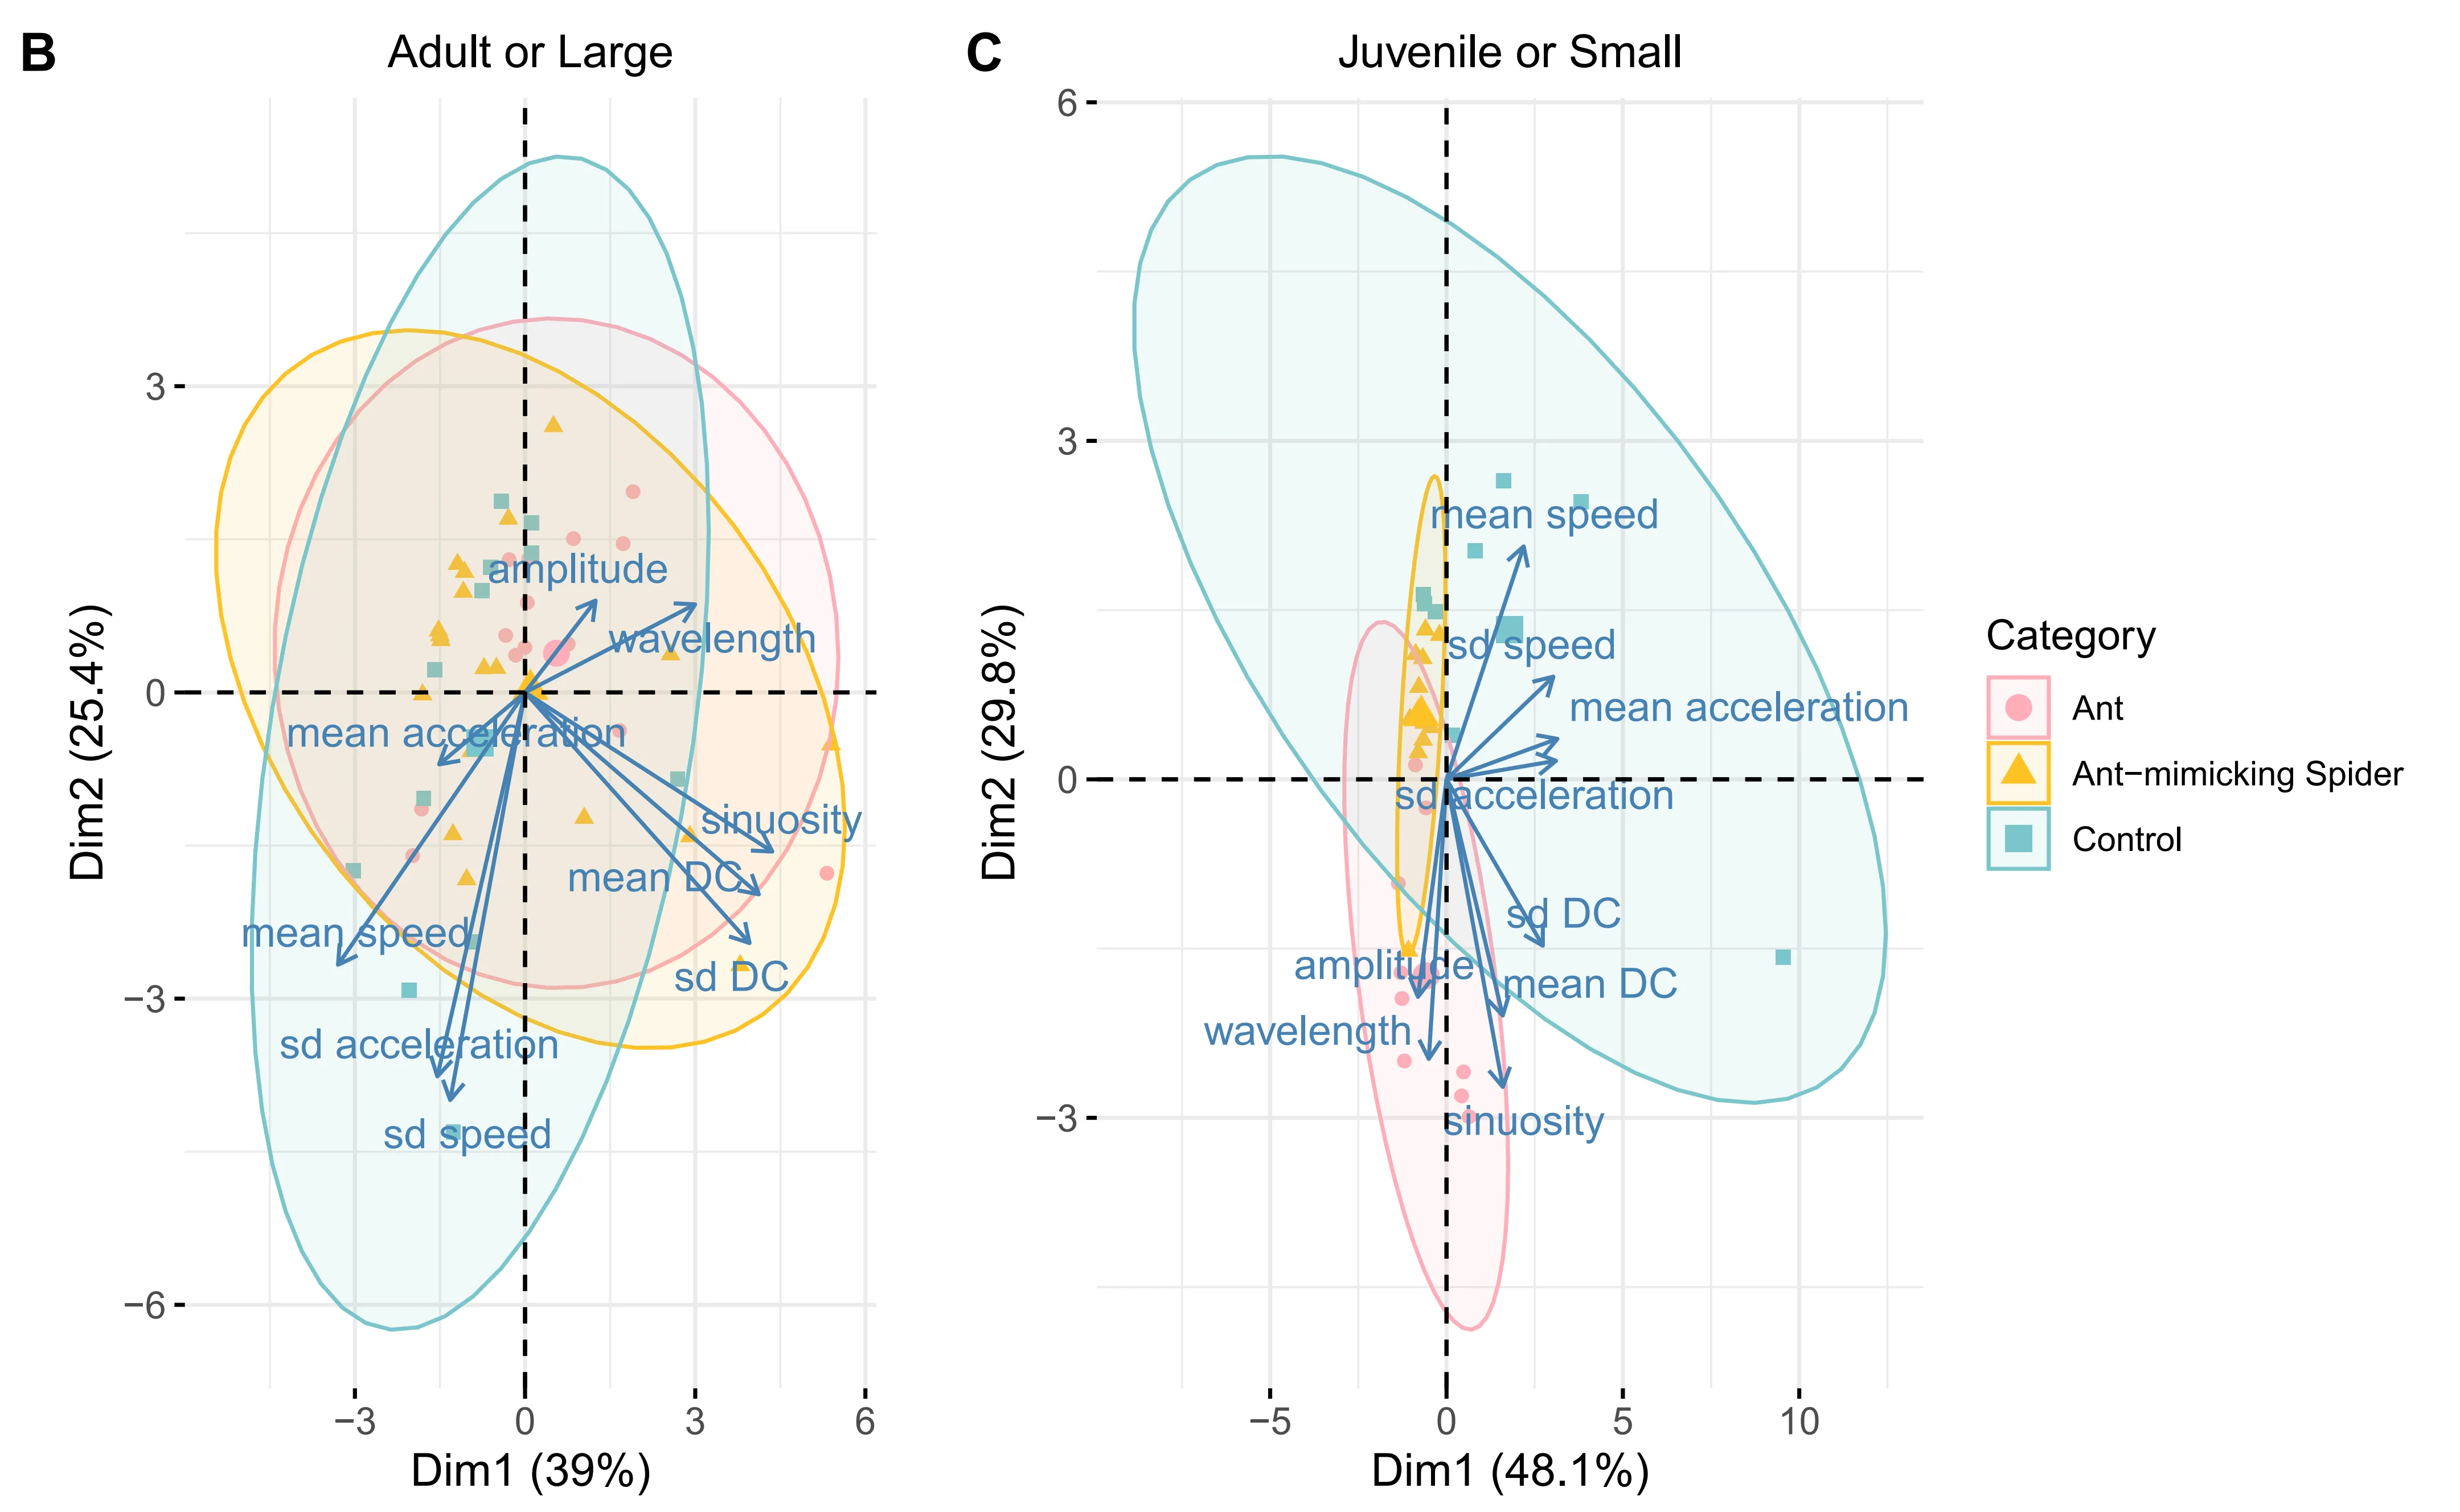
Principle component analysis (PCA) of locomotion trajectories showed clear mimicry patterns in A. kiangsiensis. Adult mimetic spiders moved similarly to large ants, while juvenile mimetic spiders resembled small ants in their movement parameters, whereas non-mimetic spiders generally differed from ants (Fig. 1B–C, Fig. S1).
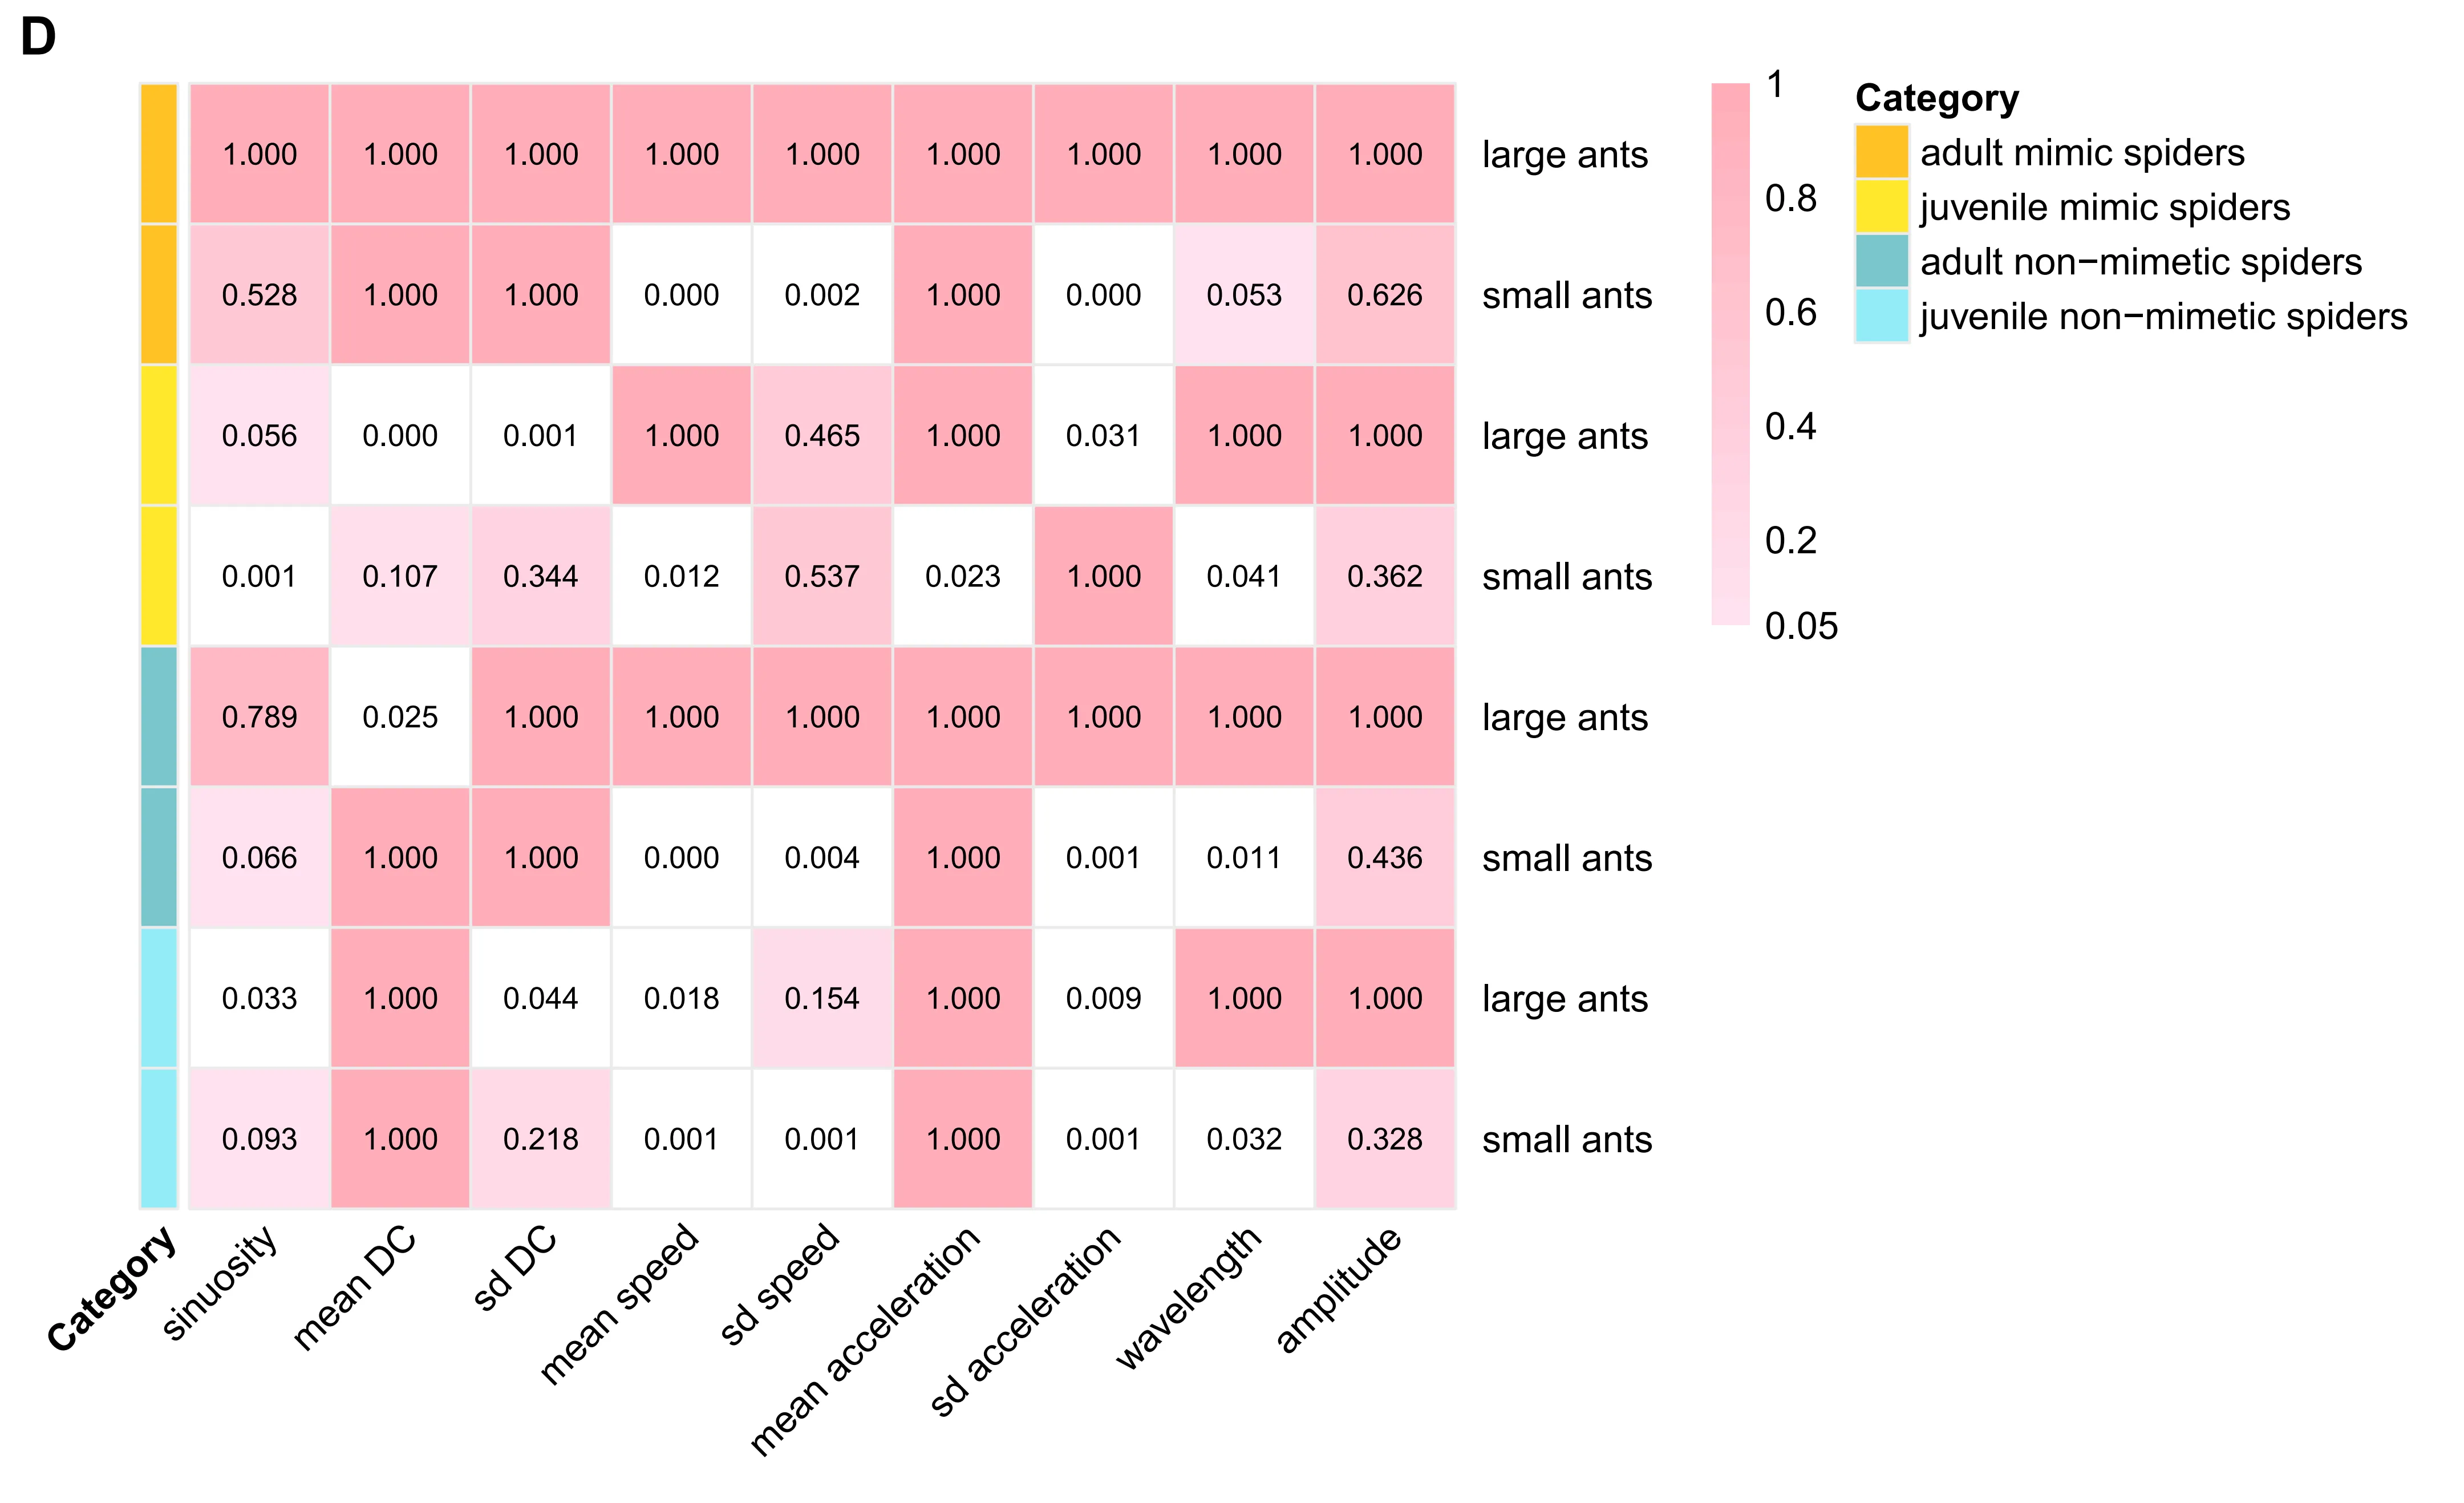
Significant differences were observed in the standard deviation of acceleration among categories, with adult mimetic spiders matching large ants and juvenile mimetic spiders matching small ants. Mean and standard deviation of directional change, as well as standard deviation of speed, also aligned with the corresponding ant size group for mimetic spiders (Fig. 1D).
Overall, these results demonstrate ontogenetic shifts in locomotor mimicry, with adult and juvenile A. kiangsiensis selectively matching co-occurring ant species according to body size.
Reflectance spectra (300–700 nm) showed that mimetic spider carapaces and abdomens overlapped closely with ant heads and abdomens. Environmental elements (dead leaves, duckweed, sticks, and soil) covered much of the same spectral range, suggesting potential for background matching (Fig. 2).
Avian visual modeling (VS and UVS systems, receptor-noise limited) indicated that mimetic spiders are difficult for birds to discriminate from ants in both chromatic and achromatic dimensions (ΔS values < 3). In contrast, spiders and ants were distinguishable from duckweed and soil (ΔS > 3), indistinguishable from sticks, and only separable from dead leaves in VS chromatic vision (Fig. 3).
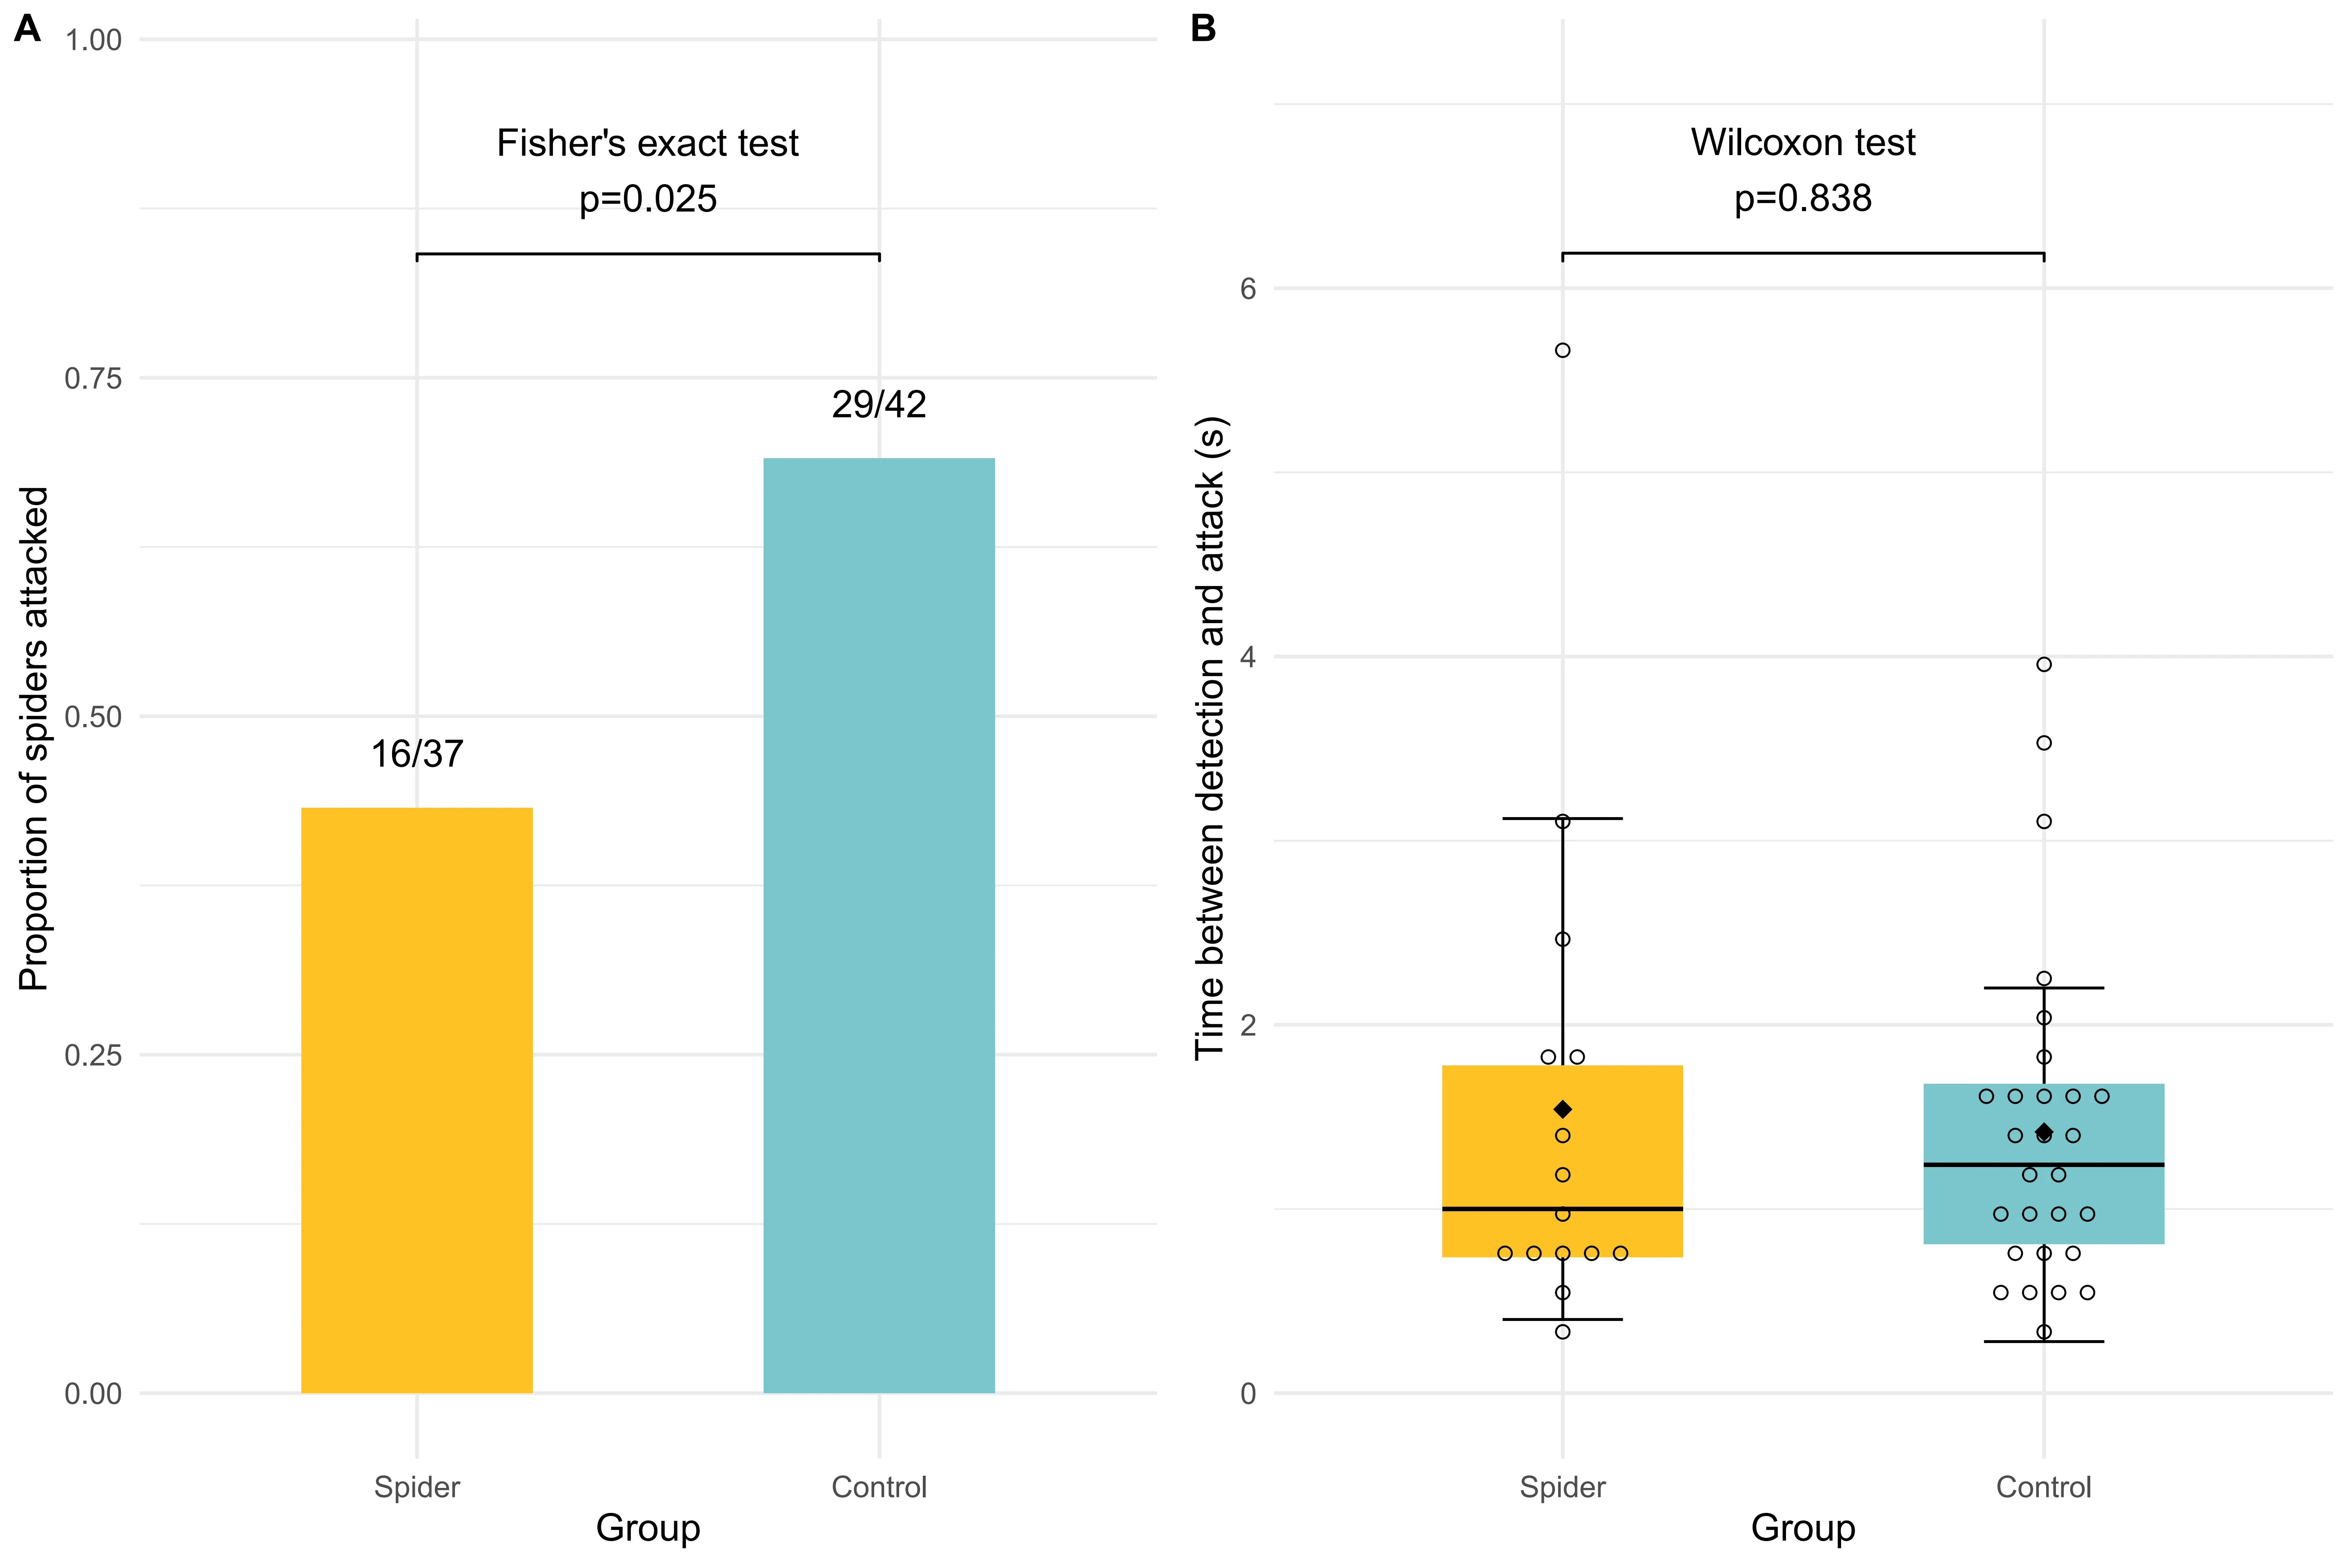
In 96 trials (79 valid observations), domestic chicks attacked mimetic spiders significantly less often than non-mimetic spiders (Fisher’s exact test, p = 0.025). However, hesitation time between detection and attack did not differ between the two spider types (Wilcoxon test, p = 0.838). This demonstrates that ant mimicry reduces predation risk, though once detected, mimics are not attacked with longer delay than non-mimics.